CHANGING IDENTIFICATION BY SEX
Overall, males were more likely than females to change identification. Over one-third (37%) of males who have ever identified as Aboriginal and Torres Strait Islander changed identification, compared to 31% of females who have ever identified as Aboriginal and Torres Strait Islander.
5.1 Consistency of identification as an Aboriginal and Torres Strait Islander person by sex, 2006-2016(a)
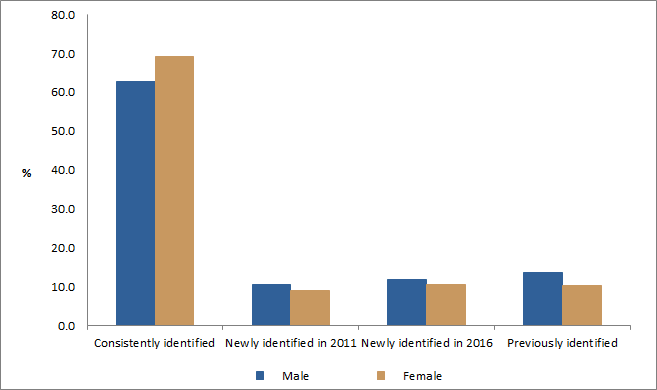
(a) Persons aged 10 years and over in 2016.
For further detail, see Table 9 in the data cube titled ‘ACLD 2006-2011-2016 Identification as an Aboriginal and Torres Strait Islander person in the Census over time’.
Note: Cells in this graph have been randomly adjusted to avoid the release of confidential data. Discrepancies may occur between sums of the component items and totals.
Source: ABS 2019, Microdata: Australian Census Longitudinal Dataset, ACLD, cat no. 2080.0, ABS Canberra.
However, within the group who changed their identification, there were some differences between males and females:
- Females were more likely than males to be newly identified in 2016 (34% compared to 31%).
- Males were more likely than females to be previously identified (37% compared to 33%).
5.2 Persons whose Indigenous status has changed by sex, 2006-2016(a)(b) |
|
 | | Male | Female | Total |
| |
|
| | % |
|
| Newly identified in 2011 | 27.9 | 28.8 | 28.3 |
| Newly identified in 2016 | 31.4 | 33.8 | 32.5 |
| Previously identified | 36.5 | 33.0 | 34.9 |
| | | | |
| Total number of persons whose Indigenous status has changed(c) | 124,092 | 109,344 | 233,547 |
|
(a) Persons aged 10 years and over in 2016.
(b) Excludes consistently identified persons.
(c) Includes persons who identified in 2016 and 2006.
Note: Cells in this table have been randomly adjusted to avoid the release of confidential data. Discrepancies may occur between sums of the component items and totals.
Source: ABS 2019, Microdata: Australian Census Longitudinal Dataset, ACLD, cat no. 2080.0, ABS Canberra.
 Quality Declaration
  Print Page
 Print All